
FxPro Raw+ Live Spreads — Measured, Not Advertised | FxPro Kenya
Real spreads we recorded on FxPro’s own MetaTrader 5 Raw+ feed — 6 instruments, 1,262,705 ticks sampled, last captured 2026-08-03. The spread you actually trade on, not a marketing ‘from 0.0’.
Open FxPro Account →This is the live, hour-by-hour measured spread feed (refreshed daily). For the Standard vs Raw+ cost comparison and fees, see our spreads & costs page.
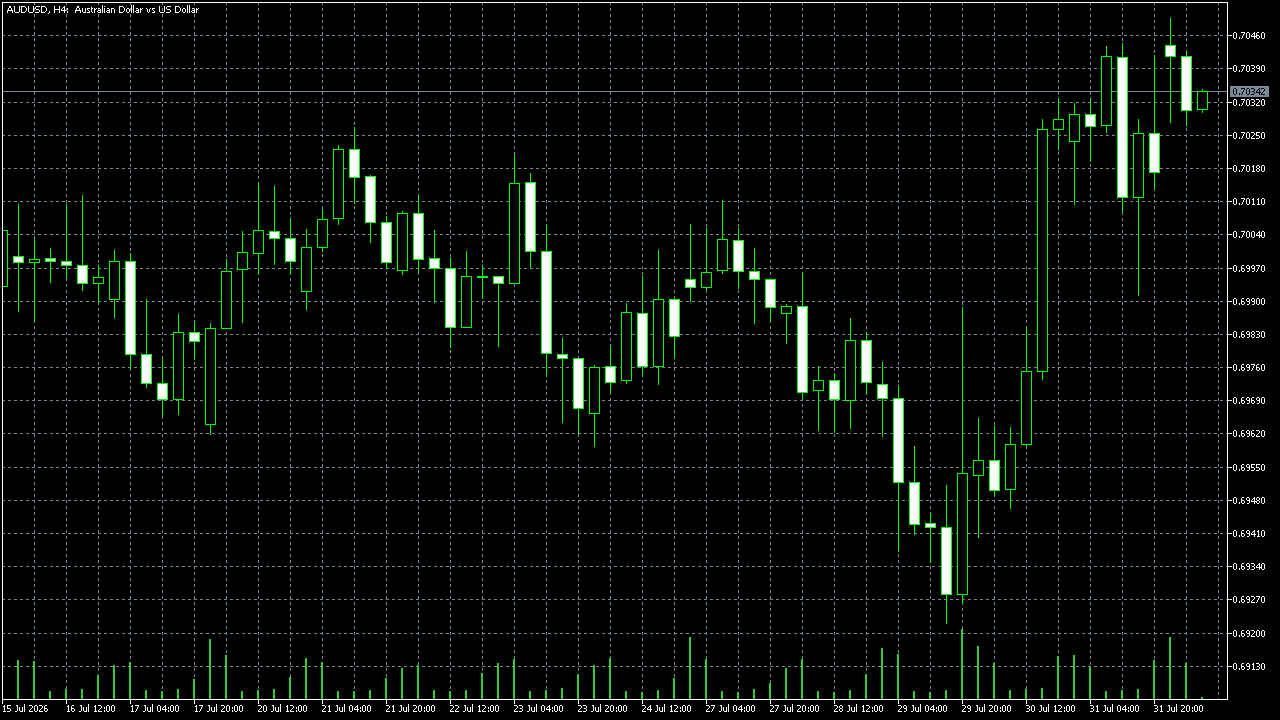
Measured Raw+ spreads (pips)
| Instrument | Best (min) | Typical (median) | Busy market (p90) | At capture | Ticks sampled |
|---|---|---|---|---|---|
| EUR/USD | 0.2 | 0.2 | 0.3 | 0.2 | 147,660 |
| GBP/USD | 0.6 | 0.6 | 0.9 | 0.6 | 198,357 |
| AUD/USD | 0.2 | 0.8 | 1.2 | 0.2 | 171,009 |
| USD/CAD | 0.1 | 0.5 | 0.9 | 0.4 | 163,829 |
| USD/JPY | 0.3 | 0.5 | 0.7 | 0.3 | 249,731 |
| XAU/USD (Gold) | 15 | 19 | 23 | 15 | 332,119 |
Best = the tightest quiet-market quote we saw; Typical = the median you usually trade; Busy market = the wider spread to expect about 10% of the time (news, rollover, thin liquidity). ‘At capture’ is the live spread at the last reading. Metals such as XAU/USD use a different contract size, so their cash cost is on our gold page. Server FxPro-MT5 Demo, feed 2026.08.03 08:50:14.
Spread through the trading day (measured, last 24h)
| Instrument | Tightest (avg) | Widest (avg) | Worst spike | Through the day |
|---|---|---|---|---|
| EUR/USD | 0.2 (03:00) | 2.376 (23:00) | 18 (23:00) | |
| GBP/USD | 0.6 (03:00) | 3.911 (23:00) | 10.6 (23:00) | |
| AUD/USD | 0.389 (07:00) | 2.535 (23:00) | 24.2 (23:00) | |
| USD/CAD | 0.334 (07:00) | 4.285 (23:00) | 18.9 (23:00) | |
| USD/JPY | 0.343 (07:00) | 4.226 (23:00) | 15 (23:00) | |
| XAU/USD (Gold) | 15.743 (07:00) | 63.107 (00:00) | 175 (00:00) |
Table hours are FxPro server time (about UTC+3 / EET); the highlighted guidance above is shown in EAT. Average pip spread by hour over the last 24 hours, with the worst single-tick spike. Spreads run tightest in the peak London–New York overlap and widen around the 00:00 server rollover and the thinner Asian hours — the sparkline is each instrument’s daily shape.
What it costs you per lot (Raw+)
| Instrument | Typical spread | Spread cost / lot | Commission (round turn) | All-in / lot | All-in (pips) |
|---|---|---|---|---|---|
| EUR/USD | 0.2 pips | $2.00 | $7.00 | $9.00 | 0.9 pips |
| GBP/USD | 0.6 pips | $6.00 | $7.00 | $13.00 | 1.3 pips |
| AUD/USD | 0.8 pips | $8.00 | $7.00 | $15.00 | 1.5 pips |
| USD/CAD | 0.5 pips | $3.56 | $7.00 | $10.56 | 1.48 pips |
| USD/JPY | 0.5 pips | $3.20 | $7.00 | $10.20 | 1.6 pips |
| XAU/USD (Gold) | 19 pips | $19.00 | $7.00 | $26.00 | 26 pips |
All-in round-turn cost for one standard lot (100,000 units): typical spread × pip value, plus the $7 Raw+ commission ($3.50 per lot per side ($7.00 round turn) on Raw+ and cTrader accounts). On a Standard account you pay a wider spread instead of that commission — see the full spreads and costs page.
Open FxPro Account →Advertised ‘from 0.0’ vs what we measured
FxPro markets Raw+ as spreads ‘from 0.0 pips’ — a best-case floor. Across our sample the tightest EUR/USD quote we recorded was 0.2 pips and the typical was 0.2 pips. That is normal: the ‘from’ figure is a floor you rarely trade on, so judge a Raw+ account by its typical spread and how far it widens under load (the p90 column), not the headline number.
How we measured this
- Recorded on FxPro's own MetaTrader 5 Raw+ account — the broker's real pricing feed, not a third-party estimate.
- Captured in-terminal by an MQL5 expert advisor that logs every tick's bid and ask, so the spread is exactly what the platform shows.
- 1,262,705 ticks across 6 instruments; the figures refresh on a schedule.
- Demo and live Raw+ share the same pricing feed, so these spreads are representative of a funded account.
Spreads are variable and widen around high-impact news and the daily rollover. Past readings do not guarantee future spreads. Last updated 2026-08-03.